Page 1 of 2
spectrum of bridgelux & samsung strips
Posted: Sun Mar 18, 2018 10:08 am
by tazztone
i made these graphs to find out how far from optimal the spectra of the LEDs are.
[UPDATE: i deleted the PAR graphs because they aren't correct. see next posts with the correct graphs]
please let me know if i have understood incorrectly:
1. the LED's waste a lot of light because they emit at 500 - 600nm, where not much photosynthesis occurs.
2. we would like to have more "body" in the 400-500nm region.
3. the 600nm peak should move to 650-700nm.
4. the strips would ideally be supplemented with some ~415nm and ~675nm LEDs to enrich their spectrum.
i looked at
lm301B,
lm561C and
bridgelux eb2 spectra.
the colored action curve (PAR) indicates the overall rate of photosynthesis. Source:
http://ib.bioninja.com.au/standard-leve ... ctrum.html
Re: spectrum of bridgelux & samsung strips
Posted: Sun Mar 18, 2018 5:27 pm
by Jolly Green Giant
imo.. I don't think the 500-600nm range is wasted light... we just don't have a clue what it does yet... if we only needed red and blue, why does the sun have all of them?? it's got to have a purpose ( same with IR I think we need some just not freaking 20% like a hps

)..
I don't fully trust/rely on the in vitro red/blue studies from the 1950's.... we need more in vivo testing with cyan-green thru yellow light!!!!!!

. forget the test tube... grow the dang plant!!!
Re: spectrum of bridgelux & samsung strips
Posted: Sun Mar 18, 2018 11:57 pm
by Maxxor
.
Re: spectrum of bridgelux & samsung strips
Posted: Tue Mar 20, 2018 4:33 pm
by LivingLight
Hello
I'm sorry but the photosynthetic activity you are using is not leading to any correct interpretation, it's in-vitro absorbance of the pigments.
Here is a spectrum of an in-vivo experiment, so directly mesured on a leaf:
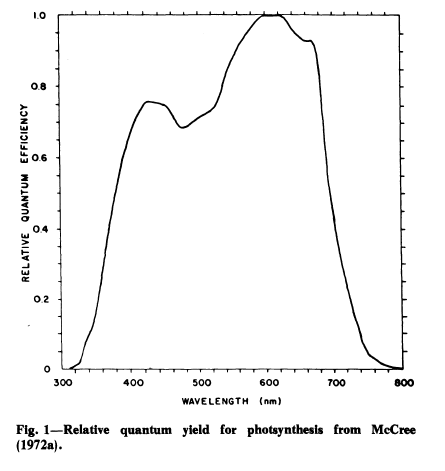
There are hundreds of spectrums like this one made by several scientists for decades.
Also, the way you are drawing the emission spectrums is not viable to compare one to the other, plotted this way, the two led spectrums are not normalised to an equal amount of light. To compare two spectrums you must check that the area under the curve is the same for both sectrums.
Finally, if you want to improve your spectrum using secial colours, you should start by general physiological réactions rather than photosynthesis. Depending on what kind of plant you want and the way you wanna grow them.
Hope this helps. If u want any information just ask
Re: spectrum of bridgelux & samsung strips
Posted: Tue Mar 20, 2018 5:50 pm
by Jolly Green Giant
LivingLight wrote: ↑Tue Mar 20, 2018 4:33 pm
Hello
I'm sorry but the photosynthetic activity you are using is not leading to any correct interpretation, it's in-vitro absorbance of the pigments.
Here is a spectrum of an in-vivo experiment, so directly mesured on a leaf:
There are hundreds of spectrums like this one made by several scientists for decades.
Also, the way you are drawing the emission spectrums is not viable to compare one to the other, plotted this way, the two led spectrums are not normalised to an equal amount of light. To compare two spectrums you must check that the area under the curve is the same for both sectrums.
Finally, if you want to improve your spectrum using secial colours, you should start by general physiological réactions rather than photosynthesis. Depending on what kind of plant you want and the way you wanna grow them.
Hope this helps. If u want any information just ask
I've been waiting for someone like you to join!!!
someone that has way more knowledge into spectrums than me just talking what I've picked up here and there without testing it!!!
Re: spectrum of bridgelux & samsung strips
Posted: Tue Apr 03, 2018 11:11 am
by tazztone
thanks for correction. i wasn't sure which curve should be used. i found this on econolux industries article:
now
overlayed with your mccree graph (thin black line) it looks like this:
the colored graph i found on fluence.science/science/photosynthesis-guide/ has some more far-red activity somehow.
.
for LM561C:
for EB gen2
.
LivingLight wrote: ↑Tue Mar 20, 2018 4:33 pm
If u want any information just ask
should we
increase red & decrease far-red and
increase blue at the same time to get
shorter/compact plants?
maybe we could supplement the lm561C strips with blurple lights? they often have 460nm/660-680nm peaks.
.
and finally supplement some
UVA up to 430nm to get more medicinal flavonoids (or THC)?

the UV LED aren't very efficient tho. what's best?
Re: spectrum of bridgelux & samsung strips
Posted: Tue Apr 03, 2018 4:37 pm
by HalfBee
Not fair... I want to see the 3500K and 4000K model for the EB strips EXACTLY
like shown on the other graphs. It has always bothered me that they only give
3000K and 4000K on the EB datasheets instead of ALL the models they make.
Great job, just my half an opinion...
Re: spectrum of bridgelux & samsung strips
Posted: Wed Apr 04, 2018 9:02 am
by LivingLight
tazztone wrote: ↑Tue Apr 03, 2018 11:11 am
thanks for correction. i wasn't sure which curve should be used. i found this on econolux industries article: par vs mccree econoluxindustries.PNG
now
overlayed with your mccree graph (thin black line) it looks like this:
LM301B 3500 vs 4000K vs par _addedforumgraph.jpg
the colored graph i found on fluence.science/science/photosynthesis-guide/ has some more far-red activity somehow.
.
There are different curves for many species and conditions. The McCree curve is made over 24 different species if i remember well. So you may find some more specific curves.
Also beware to use the energy relative curve (if your led spectrum is plotted by energy unit) because you are actually using the photon fluence relative curve i think:
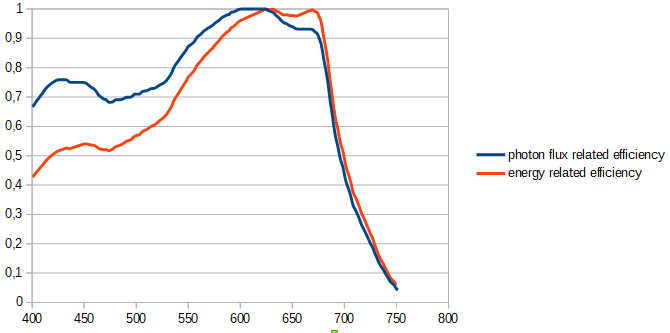
Rather than using my eyes i prefer to use numbers for comparisons. By multiplicating the spectrum by the photosynthetic curve you can get a relative photosynthetic efficiency.
here an exemple of normalised spectrums using energy related photosynthetic efficiency curve for calculation of the relative efficiency:
Bridgelux vero gen7 3000k vs 4000k
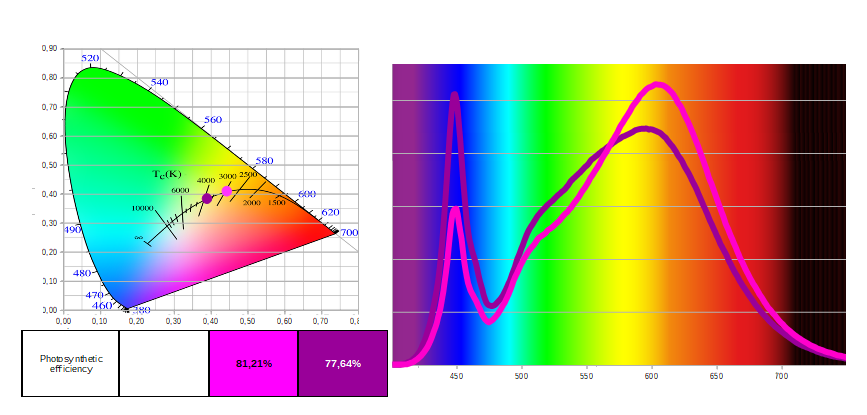
I would like to warn you about this information that is given by the photosynthetic efficiency curves. Even getting the very special curve of your specie and strain, this information is incomplete. The photosynthetic efficiency is altered by many physiological responses to environment. These reactions can lead to a sharp decrease in photosynthetic efficiency and are highly dependent on absolute and relative colours rate in your spectrum. So you can get a very bad photosynthetic activity using a spectrum that rate very high on McCree curve or on every other curve because the exeriment leading to these curves is not considering morphological reactions to the light.
Re: spectrum of bridgelux & samsung strips
Posted: Wed Apr 04, 2018 4:23 pm
by tazztone
your calculator/simulator from your other post is amazing.
https://www.catupload.com/download/015b ... 2cf70.html
i used it to compare bridgelux EB GEN1 (dark line) with LM561C (pink line).
if Gen 1 fares so good, i wonder how EB Gen2 does (or VESTA series). any plans to add them?
Re: spectrum of bridgelux & samsung strips
Posted: Wed Apr 04, 2018 7:05 pm
by LivingLight
I didn't know they made a strip with the vesta series, concerning the eb gen2 it doesn't seems to be really available for now. There were some on digikey but it looks like they went off really fast. I didn't check today but last week it was out of stock.
Every single person i gave this simulator deleted the multicolour background on the graph

is it so ugly?


